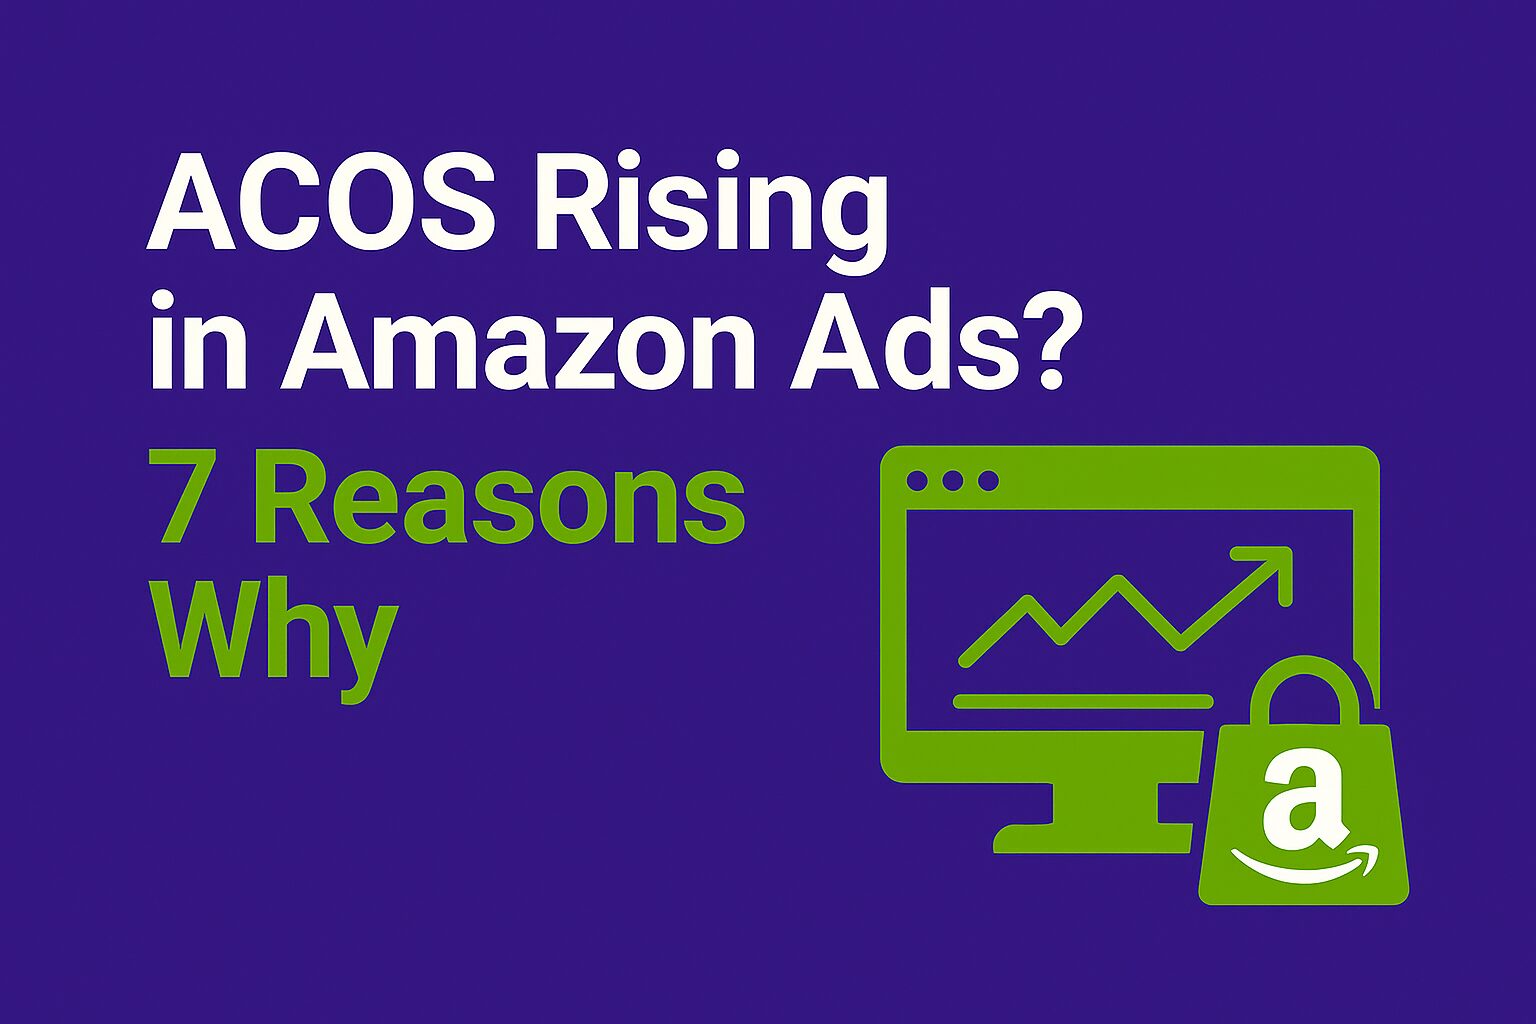
Retail Media Strategy

Explore expert Retail Media Strategy designed to maximize digital advertising performance and fuel sustainable business growth.

Infographic with a deep purple background featuring the title “Seller’s Compass” in white and “Choosing the Right Marketplace” in green. On the right, an icon of a compass or directional sign symbolizes strategic decision-making for sellers navigating multiple marketplace options.
,

Choosing the right marketplace can mean the difference between stagnant sales and explosive growth. With dozens of platforms available—each with […]

Infographic with a deep purple background displaying the title “7 Competitive Levers” in white and “Marketplace Pros & Cons” in green. On the right, an icon of a balanced scale or checklist reflects the evaluation of strengths and weaknesses across marketplace platforms.

Selling on a marketplace can accelerate your brand’s growth—but it’s not without its trade-offs. In this guide, we unpack seven

Infographic with a deep purple background featuring the title “The Ultimate Marketplace Atlas” in bold white and green text. On the right, an icon displays a simplified map or globe with markers, representing strategic marketplace navigation and international reach.
, ,

Navigating today’s marketplace landscape requires clarity. In 2025, there are dozens of platform types—each with its own rules, fees, and

Infographic with a deep purple background featuring the text “Incrementality Test” in white and “2025 Retail Media Attribution” in green. On the right, an icon shows a graph with a magnifying glass or comparison bars, representing the evaluation of media effectiveness through incrementality.
, ,

Relying on last-click models alone can obscure your campaign’s true impact. An Incrementality Test isolates the causal effect of retail

Infographic with a deep purple background featuring the title “Share of Search & Shelf” in white and “The Perfect Time to Sell” in green. On the right, a minimalist icon combines a magnifying glass and a retail shelf, representing the connection between online visibility and in-store presence.
, ,

In retail media, raw ad metrics only tell half the story. To truly assess your brand’s digital visibility, two advanced

Infographic with a deep purple background featuring the title “Marketplace 2025” in white and “The Perfect Time to Sell” in green. On the right, a white icon of a shopping cart and upward arrow represents growing opportunity and sales potential in digital marketplaces.

Global e-commerce is on fire—projected to exceed $6.5 trillion in 2025 (Digital Commerce 360¹). Yet many brands still struggle to

Scroll to Top