Online ads capture clicks, but real revenue often happens in physical stores. To close that gap, brands must embrace Digital-In-Store measurement: tracking foot traffic and linking it to in-store conversions. As highlighted by Think with Google, combining local search marketing with in-store analytics drives measurable lift. In this post, I share four practical steps to capture offline impact and optimize retail media campaigns.
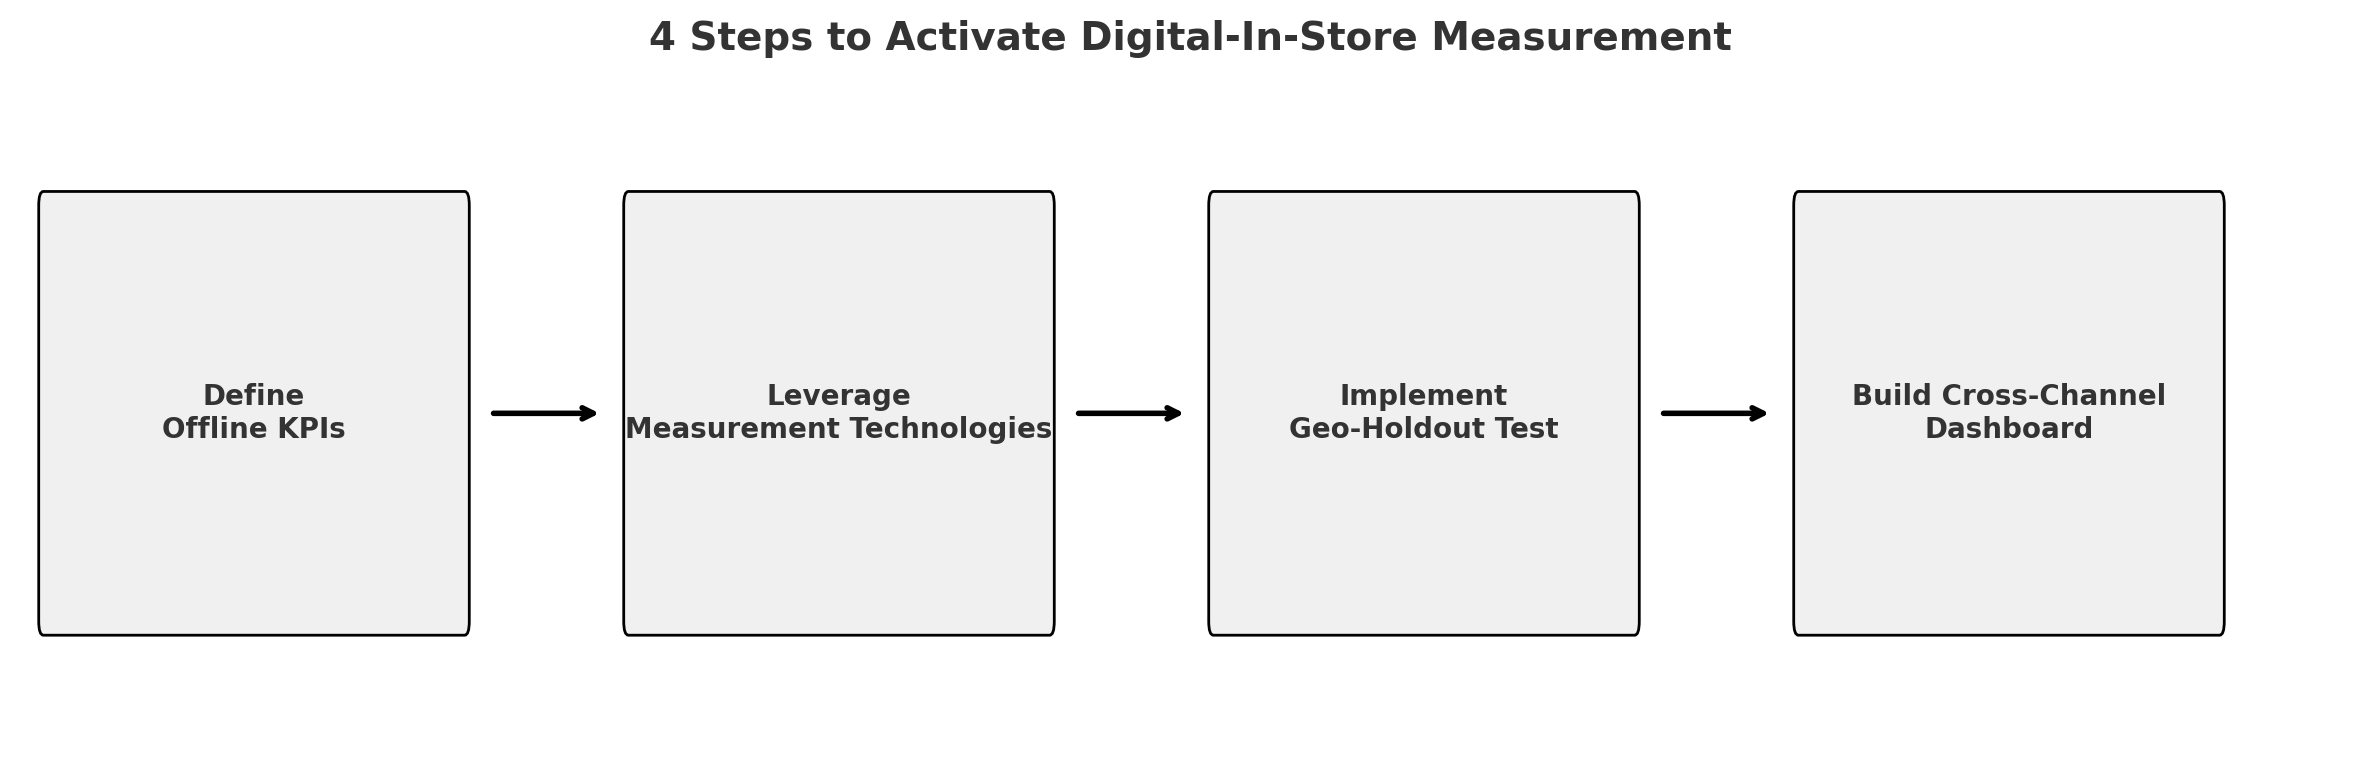
1. Define Your Offline KPIs
Start by choosing the right metrics:
- Foot Traffic: Total store visits during your campaign window.
- In-Store Conversion Rate: Percentage of visitors who make a purchase.
- Sales Lift: Incremental revenue compared to a control group.
These should align with your digital KPIs (like iGRP and incremental ROAS) to provide a unified view of performance.
2. Leverage Measurement Technologies
- In-Store DOOH Analytics: Use digital screens equipped with sensors or cameras to estimate impressions and engagements.
- Mobile Location Data: Collaborate with providers such as Google’s Store Visit Conversions or third-party footfall analytics platforms.
- Point-of-Sale Integration: Connect POS systems with ad-server logs to enable closed-loop reporting. I explain this further in Closed-Loop Reporting: Retail Media Campaign Follow-Up.
“Place Exchange built PerView in response to buyers and sellers needing a solution for dynamic reach, frequency, and impression measurement applicable across the entire OOH category.”
—Ari Buchalter, CEO at Place Exchange (source)
3. Implement a Simple Geo-Holdout Test
Set up a control region where ads are paused and a test region where ads are live:
- Compare foot traffic and sales.
- Measure incremental lift beyond last-click attribution.
- Rotate regions to account for seasonality and local market effects.
I cover a use case in Programmatic In-Housing.
4. Build a Cross-Channel Dashboard
Combine data across formats:
- iGRP / Reach: To monitor digital campaign awareness.
- Foot Traffic: From in-store analytics systems.
- Incremental ROAS: From closed-loop transaction data.
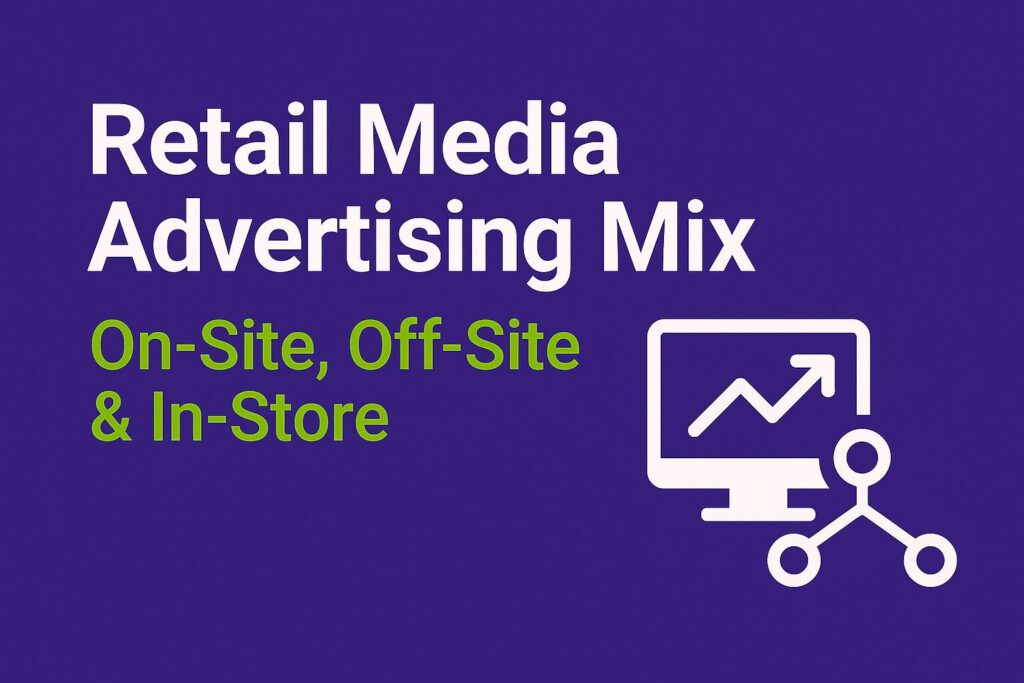
Use tools like Google Data Studio or Tableau for real-time, multi-source dashboards. More insights in Retail Media Advertising Mix. See also the Retail Media Guide 2024 by IAB Europe.
Visual Summary
Here’s a quick view of the 4 core steps:
Example in Action
During a summer campaign, one brand:
- Activated Sponsored Products on Amazon.
- Used local inventory ads to drive store visits.
- Measured in-store traffic with Google Store Visit Conversions.
The outcome: +28% uplift in store sales in the geo-tested region, leading to a 15% budget increase for in-store DOOH media.
Emerging Technologies in Digital In-Store
The in-store landscape continues to evolve with innovation:
- Augmented Reality (AR): Smart mirrors enable virtual product try-ons, enhancing customer engagement (e.g. Nike, Tommy Hilfiger).
- Digital Shelf Labels: Walmart plans to roll these out in 2,300 stores by 2026 for dynamic pricing and hyper-local promotions.
- AI-Driven Heat Mapping: Using models like YOLOv8 with ByteTrack to map consumer behavior across store aisles.
Conclusion
Digital-In-Store measurement transforms offline visits into actionable insights, closing the loop between ads and physical purchases. This is post #13 in my Retail Media Mastery series. Stay tuned for #14, where I’ll explore visibility metrics like share of search and share of shelf.
Retail Media & Commerce Growth Leader with 8+ years across Amazon and leading marketplaces. I design full-funnel strategy, governance, and measurement—building operating models and developing teams to scale performance across markets. I share practical frameworks and tools for sustainable growth.