
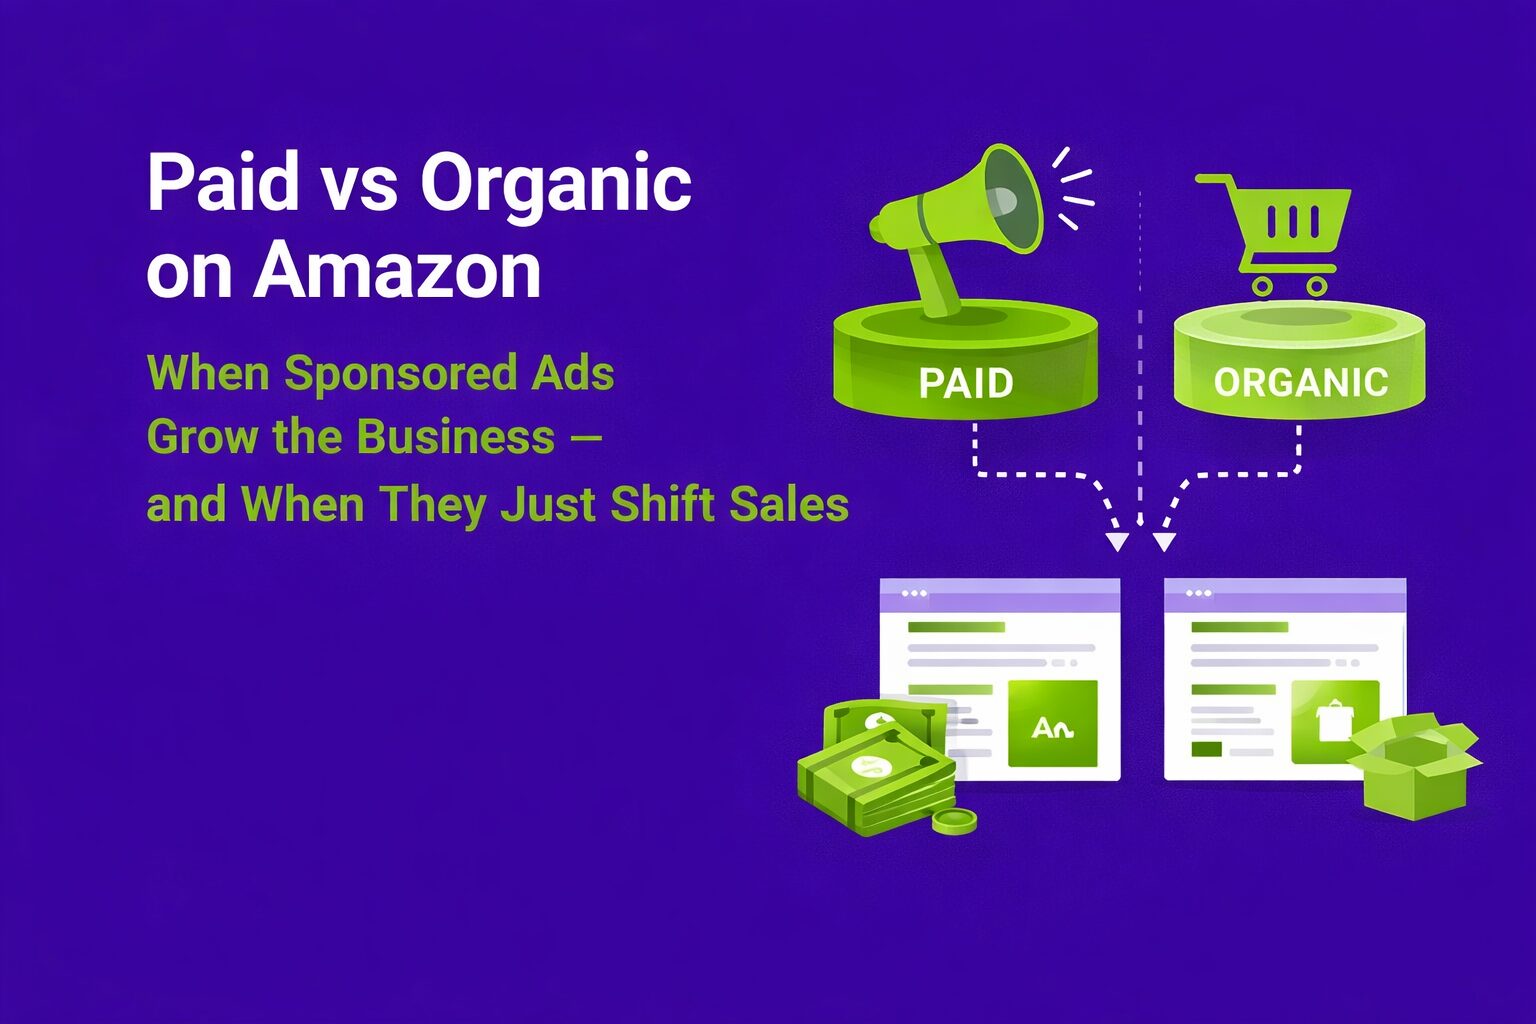
Introduction: The False War Between Paid and Organic One of the most common questions in Amazon strategy discussions sounds simple:Are […]
Explore a curated collection of best practices, actionable tips, and strategies designed to enhance your digital approach and drive business success.
Introduction: The False War Between Paid and Organic One of the most common questions in Amazon strategy discussions sounds simple:Are […]
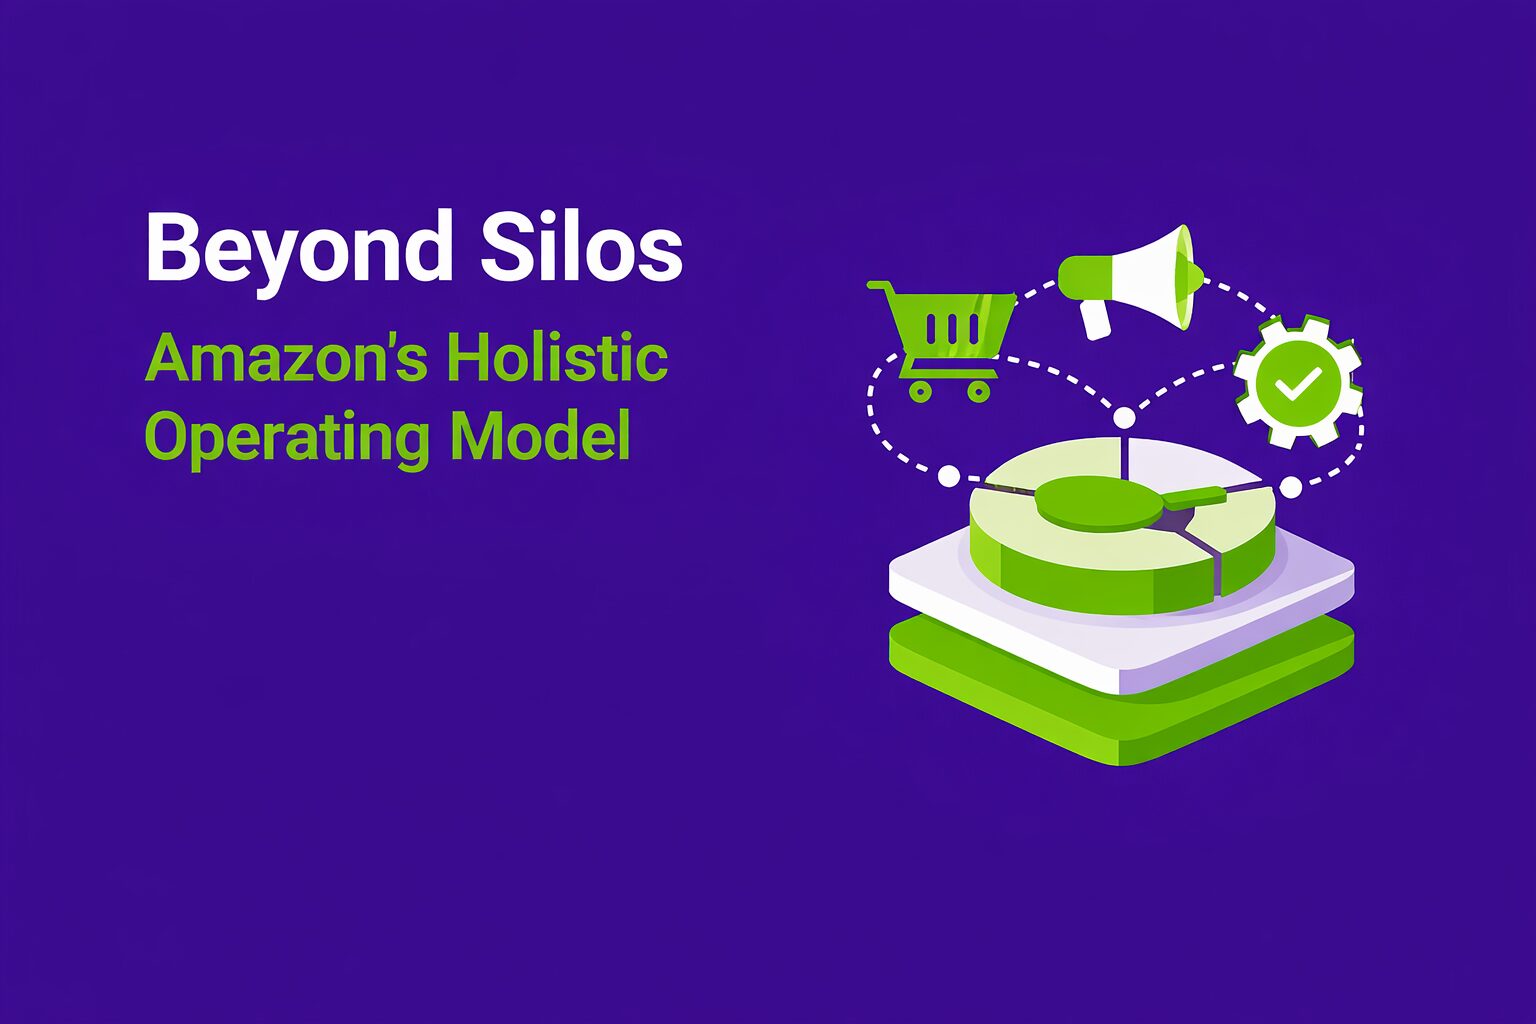
Introduction: Amazon as a Coordinated System For many mid–big brands, Amazon has evolved beyond a channel that can be managed

1. Introduction: Online vs Offline Is Not a Matter of Preference For years, the evolution of commerce in Europe has
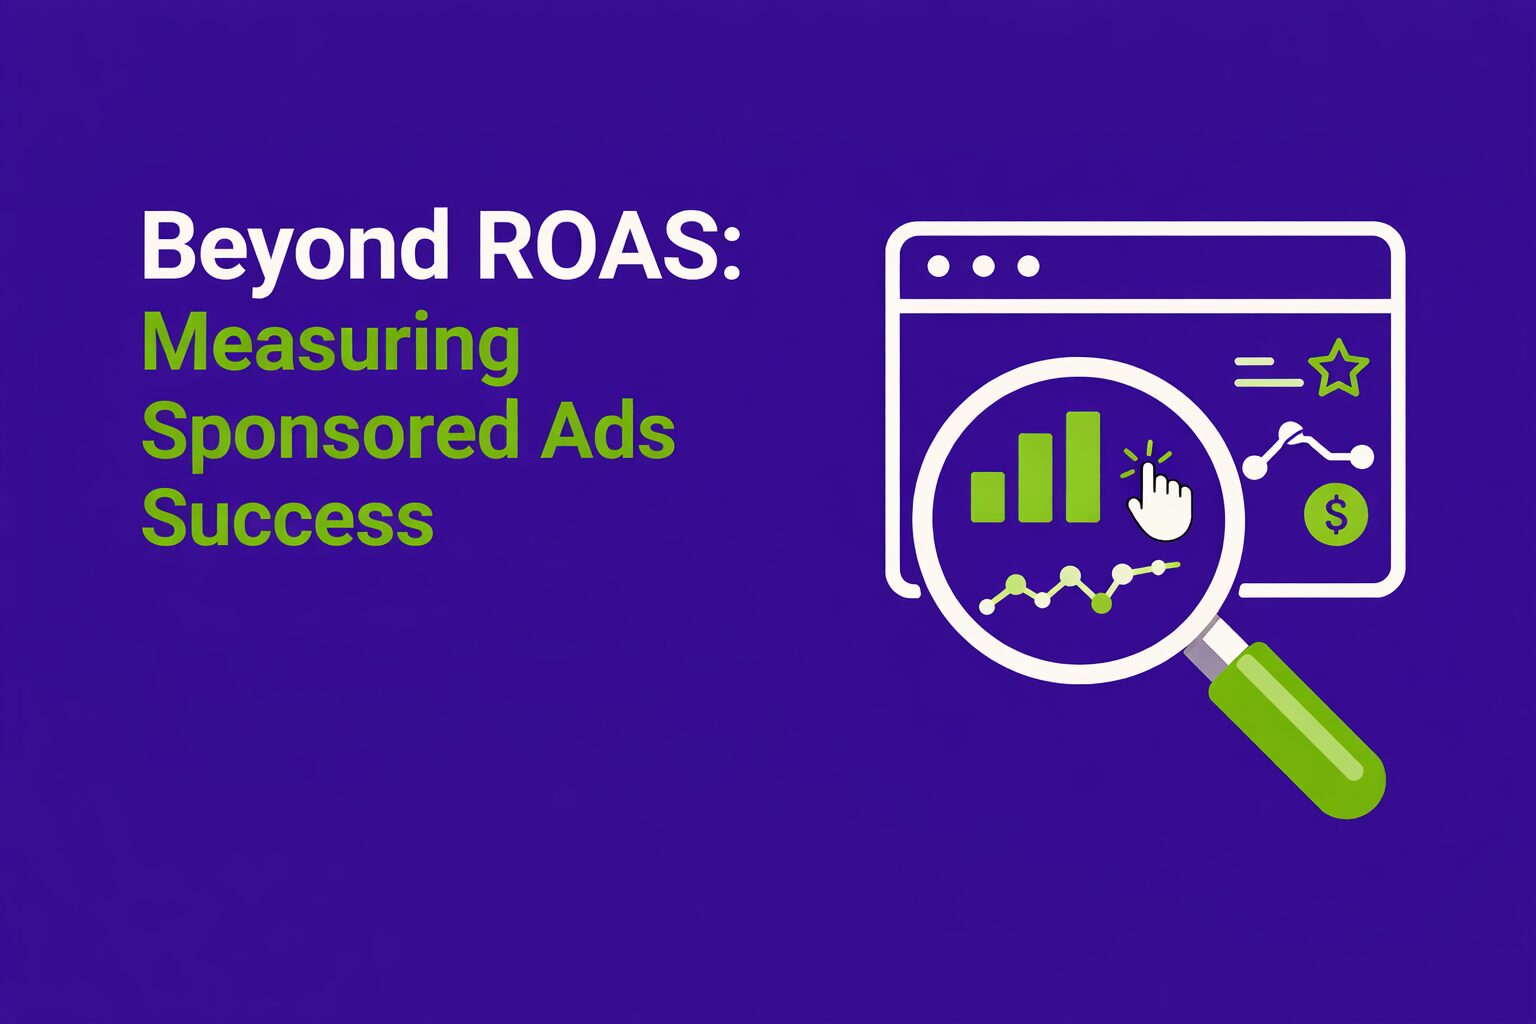
In most Sponsored Ads conversations, one metric tends to dominate the slide: ROAS. Clients ask for ROAS targets, ROAS trends
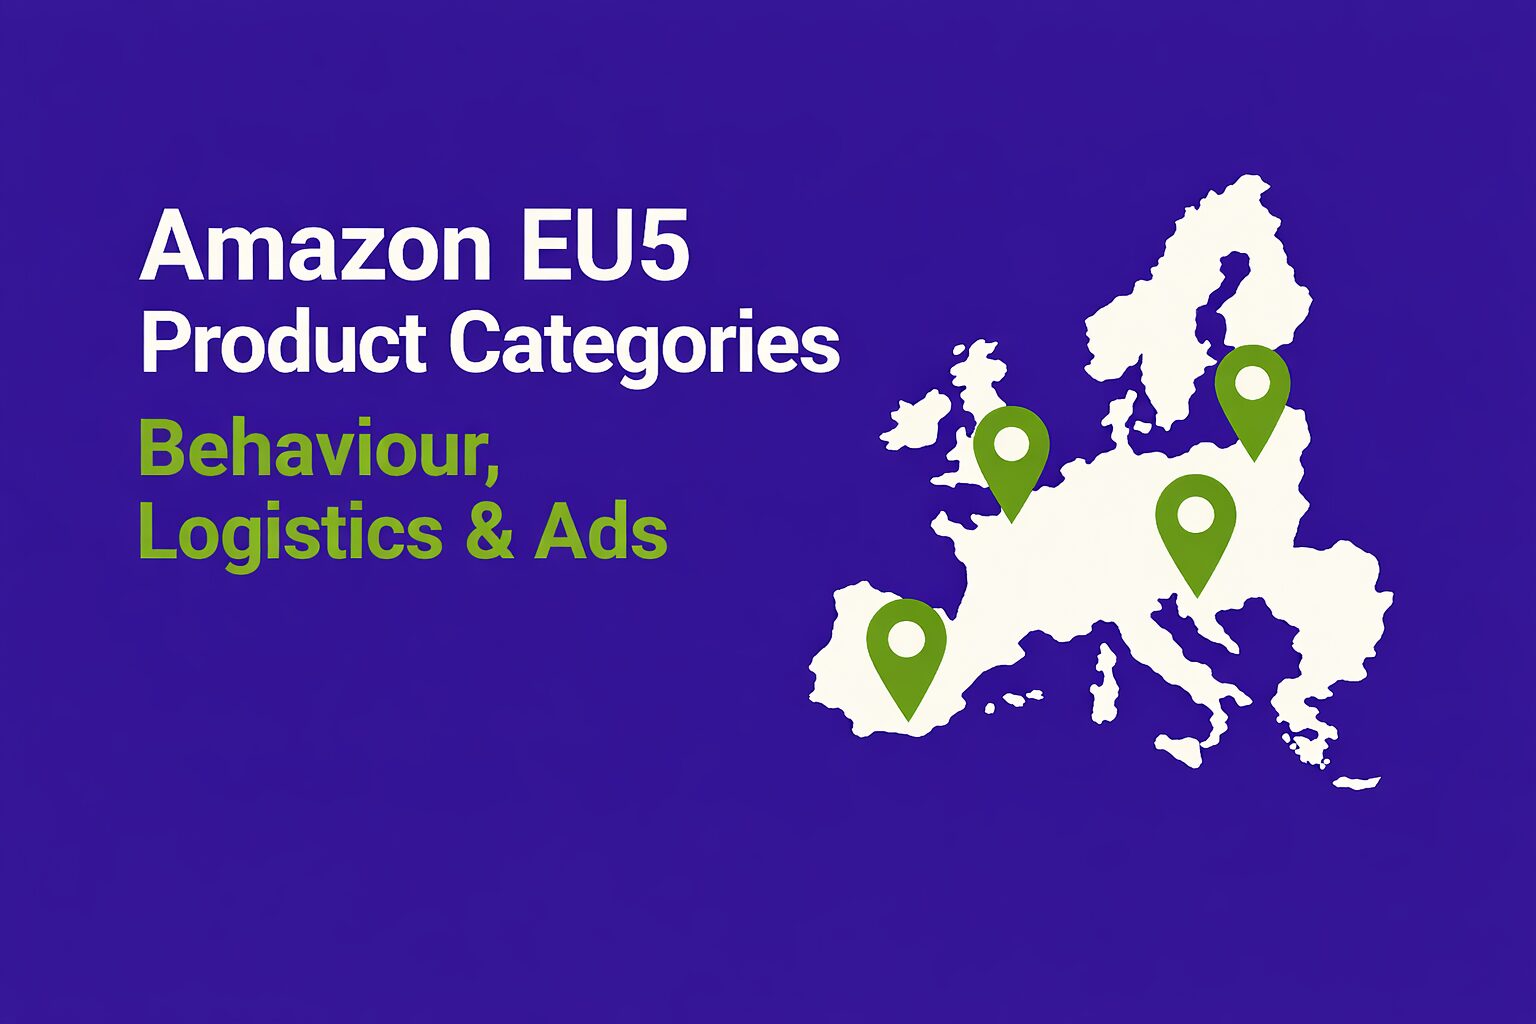
When brands talk about Amazon in Europe, the conversation usually starts with countries: “Germany is more price-sensitive.”“The UK is very

In Amazon Ads, campaign performance often appears inconsistent: ACOS increases, conversion rates fluctuate, and sales volumes shift across campaigns without