
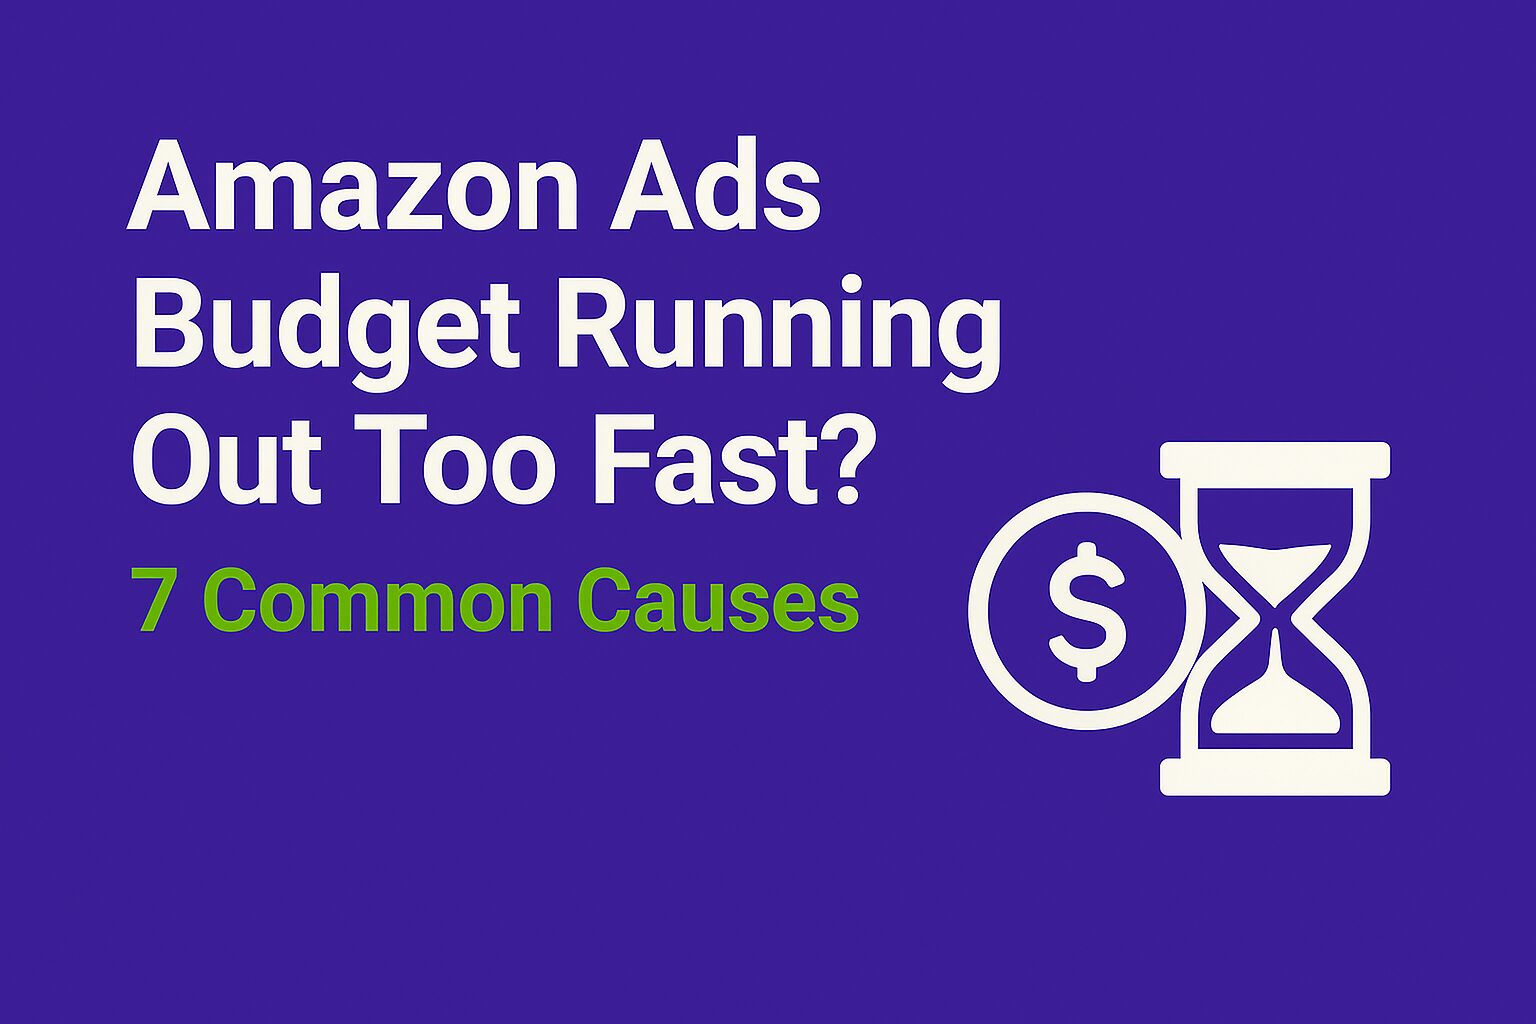
Many advertisers face the same frustration: a campaign goes live in the morning, but by lunchtime the Amazon Ads budget […]
Explore a curated collection of best practices, actionable tips, and strategies designed to enhance your digital approach and drive business success.
Many advertisers face the same frustration: a campaign goes live in the morning, but by lunchtime the Amazon Ads budget […]
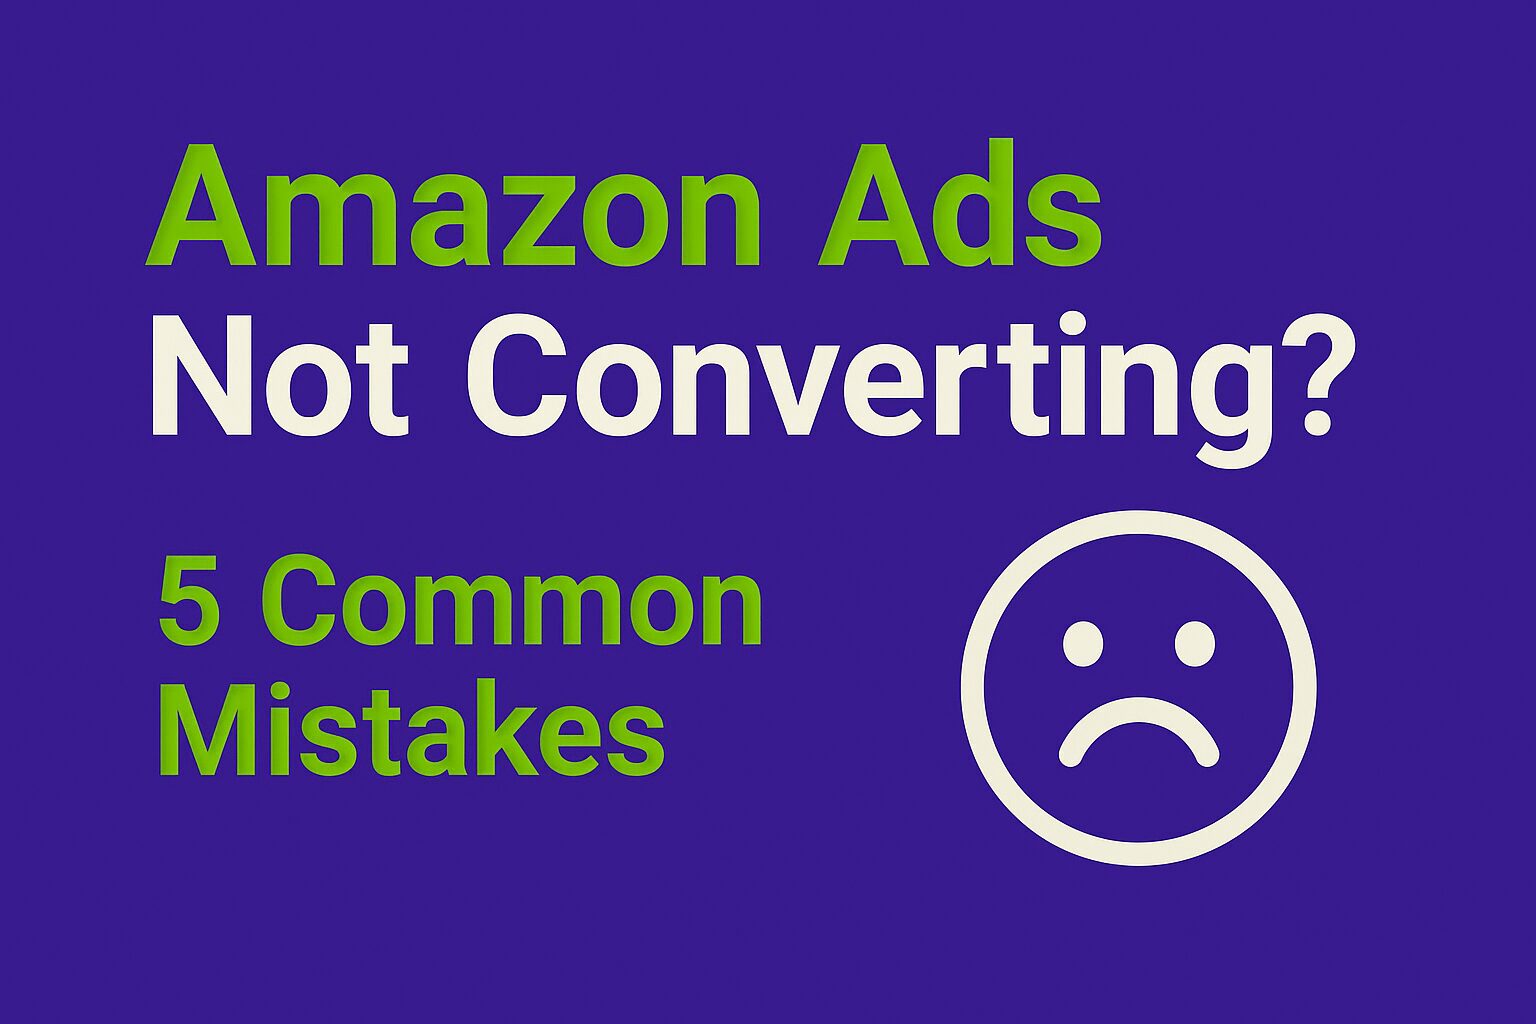
You’ve invested time, budget, and creative energy into your Amazon Ads… but the results aren’t there. Clicks are coming in,
Retail media continues to grow as brands move budgets closer to the point of sale. But one key challenge remains:
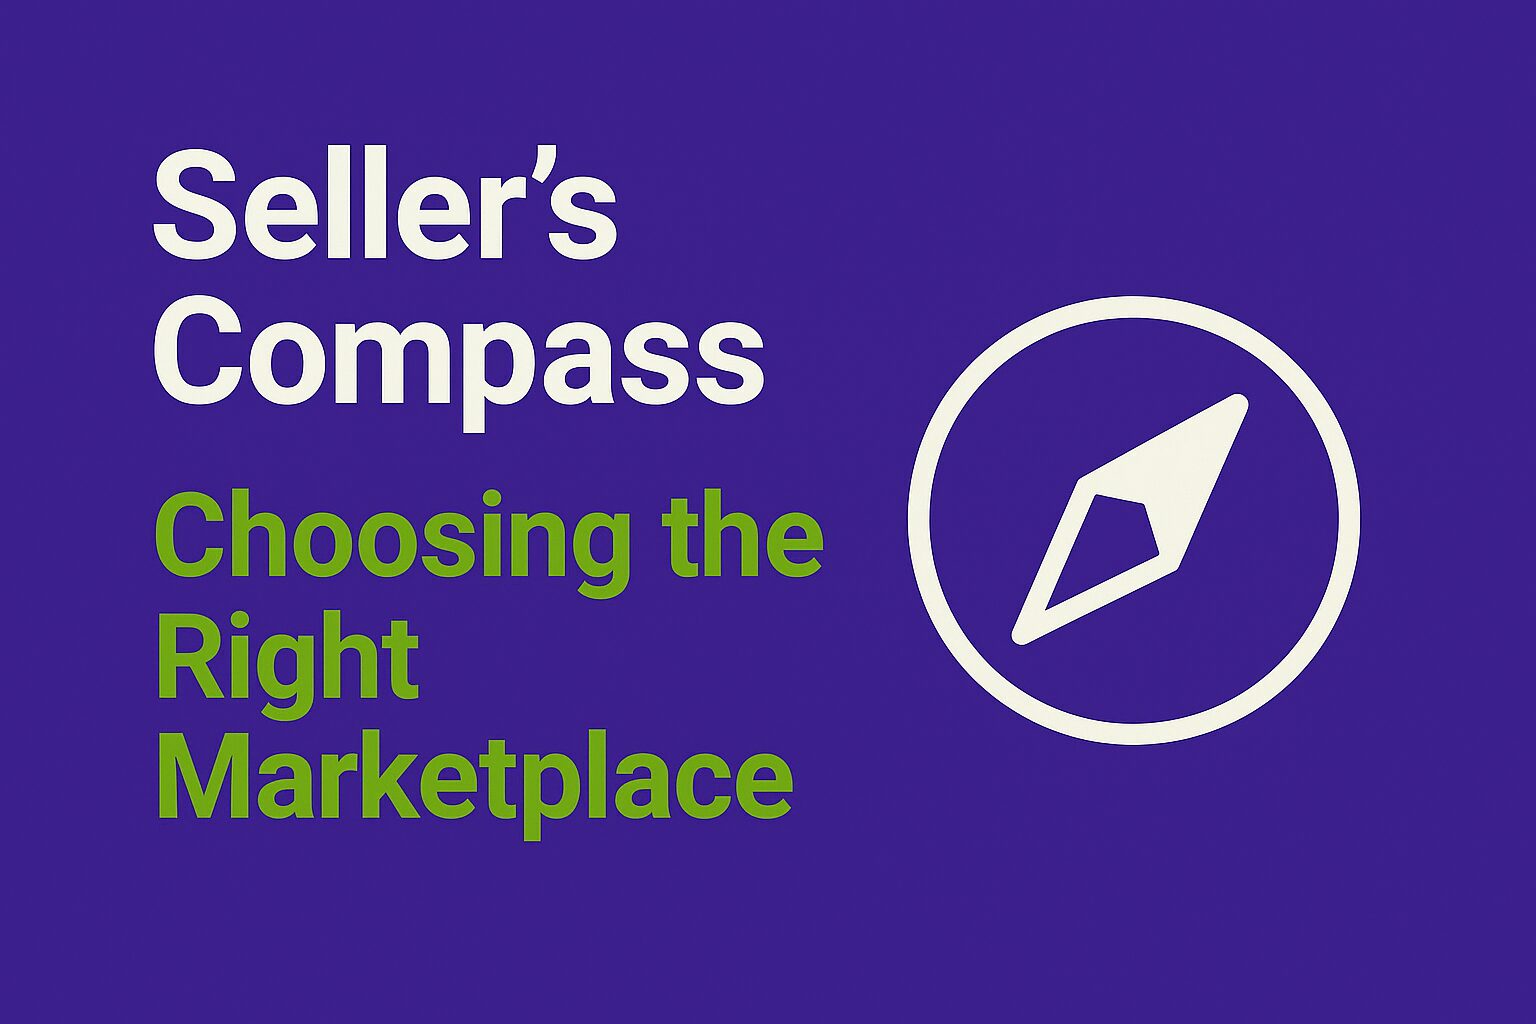
Choosing the right marketplace can mean the difference between stagnant sales and explosive growth. With dozens of platforms available—each with
Relying on last-click models alone can obscure your campaign’s true impact. An Incrementality Test isolates the causal effect of retail

In retail media, raw ad metrics only tell half the story. To truly assess your brand’s digital visibility, two advanced